1 / 1
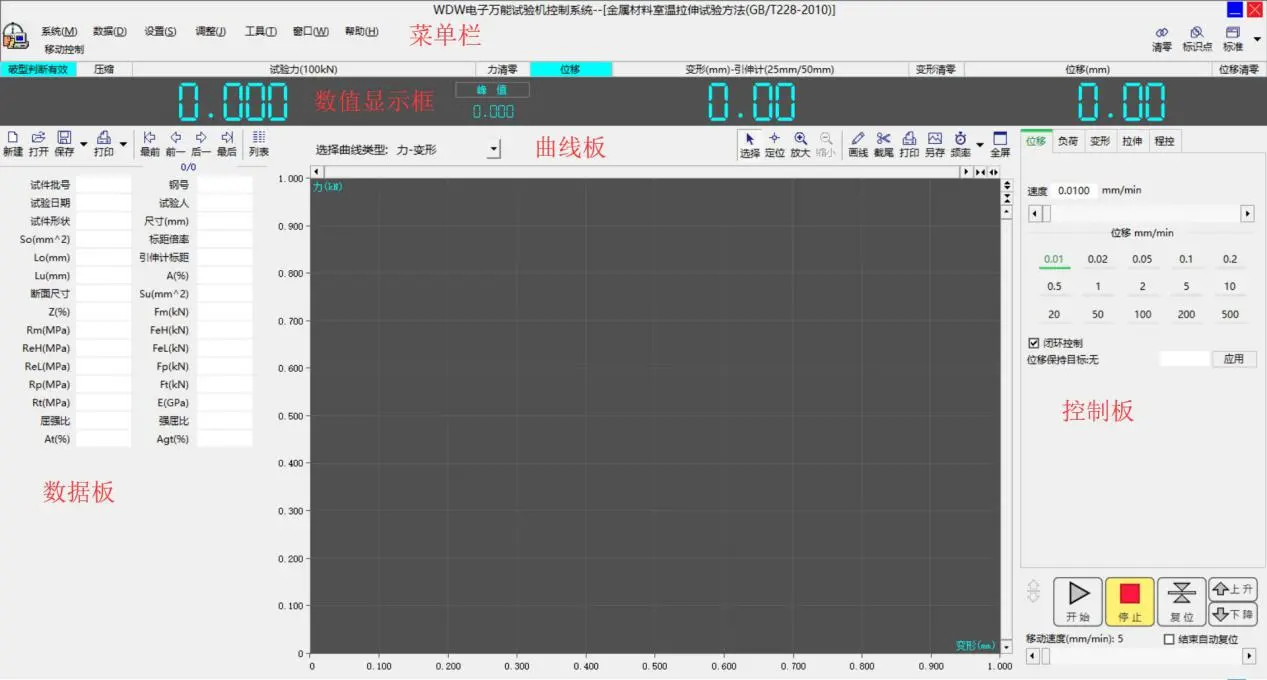
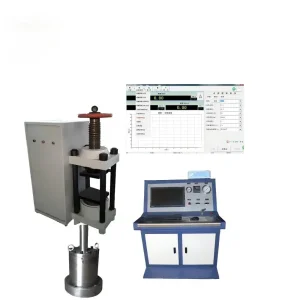
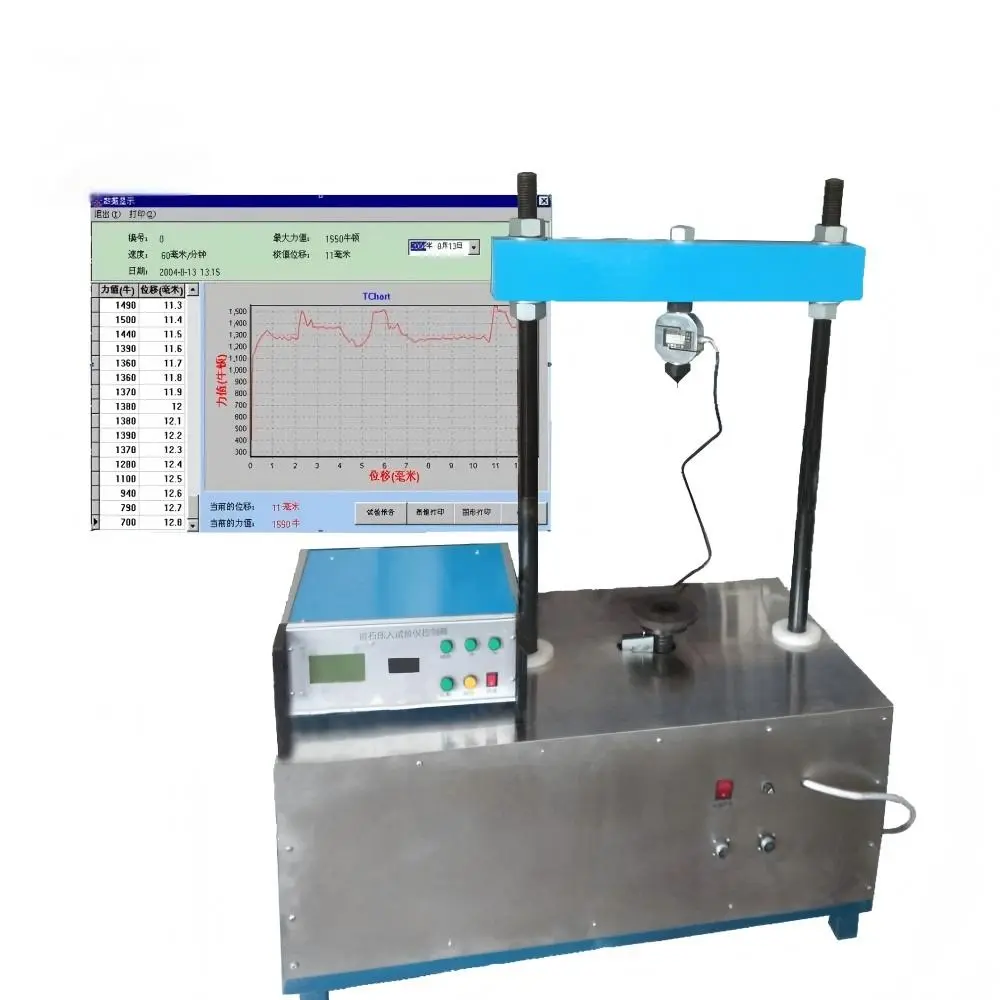
During the experiment, it can be displayed in real-time High pressure and its displacement, current pressure and its corresponding displacement.
After the experiment is completed, users can view the experimental data and graphics through the "View" button. The computer provides guidance and output for data reports and curve reports.
The processing software draws the stress-strain curve of the rock based on the collected signal data for analysis and evaluation of the rock's hardness and plasticity coefficient.